I have too many plants to monitor in a realistic time frame each week. What should I do?
This is a classic problem in monitoring for the MLMP. Fortunately, there are several examples ofsub-sampling techniques that you can use to shorten your weekly monitoring while still collecting quality data. Sub-sampling means collecting data on a subset of the milkweed plants at your site and using this to represent the whole site.
One of the most important aspects of sub-sampling is making sure that your subset of milkweeds is chosen at random. In other words, don’t just choose the plants you think are good candidates for having monarchs on them or those where you can see a juicy caterpillar. There are a few ways to do this.
There are two sub-sampling methods described on the Activity 1 (Measuring Monarch Density) datasheet. The first is the transect method; this is most effective when the milkweed plants at your site are relatively evenly distributed (not patchy) and tends to be more easily applied to larger sites. The second is a systematic approach to sub-sampling, observing only one plant for every so many that you observe or come across. In both cases, just record the number of plants that you monitor, not the total number of plants at the site. Be sure to look for small plants and not just the bigger, more obvious ones; remember randomness is crucial!
Below are examples for each of these scenarios:
Transect Method
The two photos below illustrate the two different random transect methods described here.
The site depicted is approximately 25 acres of CRP land in Wisconsin. It would be difficult for this volunteer to locate and record observations on each plant at the site, so a sub-sampling technique is used. Since the site is a large grassland and the milkweed occurs throughout the site (even though there are some patches), the transect method is chosen for this site. Above are two different techniques for implementing the transect method. In the first graphic, a random direction is regenerated for their transect by tossing a pencil in the air and traveling in the direction it points. Each time the volunteer reaches the boundary of their site, they toss the pencil and generate another random direction. If this method is used and the random direction points outside your site, simply turn 180 degrees and travel the same straight line transect back into the site (this is shown in the 2nd and 6th random directions in the graphic). They continue to generate transects until they feel they have an adequate sample size. In the second graphic, the volunteer chooses a random direction for their first transect by tossing a pencil in the air and traveling in the direction it points. Then, the volunteer turns 90 degrees back into their site and walks that straight-line transect across the site. They continue turning 90 degrees back into their site and walking additional transects until they feel that they have obtained an adequate amount of data for their site.
When using either transect method described above, observe every milkweed that falls within arms distance along that transect. Whichever method you choose, remember that it is important for your methods to be consistent from week to week. You can and should change your starting location each week, and thus will probably never walk the same set of transects during your weekly monitoring activities. In any case, use the same methodology each week, whether you are running transects or using the systematic approach described below.

Systematic Method

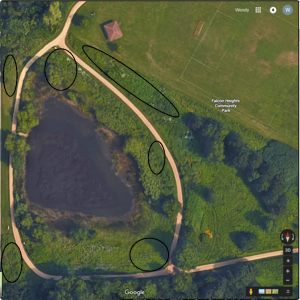
This site is near MLMP headquarters in Minnesota. The area of the site is approximately one acre, but milkweed is pretty dense at the site, most years having over 1000 plants present during the peak of the monitoring season. The black outlines represent areas where milkweed is growing in dense patches, although there are a few scattered milkweeds throughout the rest of the site. The monitoring team that completes the Measuring Monarch Density activity here each week aims to record information on about 300 of these plants. To accomplish this, they observe and record information on every third plant that they come across. Using this method they are monitoring about 1/3 of the plants at the site, and their sample is represented not only by each of the different patches at the site, but by the random milkweeds that may fall between those patches. For the ones that are not within the patches, they still use the method of observing one for every three plants they come across to maintain the random sampling procedure. You can see how a site like this would be difficult to use the transect method. Depending on your site, you can choose a different number of plants to observe for your systematic approach depending on how many plants you have time to observe each week. It might be every other plant, or every fourth or fifth plant. The important thing to note is that this number should remain constant over the course of your monitoring season. You should NOT intentionally monitor the same subset of individual plants each week; the plants you observe each week should be random.
Multiple Species Consideration
If you are monitoring multiple species of milkweed at a single site, you do not need to do multiple transects per species. Let’s say your site has both common milkweed and swamp milkweed. Using the transect method, you would monitor each milkweed (both common and swamp) you see along your straight-line transect by recording it in the appropriate table on your datasheet (if using datasheet #1 Detail). If you are monitoring using the systematic method, you would treat both species the same, only observing one for every x number that you’ve chosen to monitor. BUT, remember to record different species in the appropriate table on your datasheet if using datasheet #1 Detail (use a separate table for each species).

